Environmental Data
Independent Assurance Report
The environmental data marked with ★ has been assured by KPMG AZSA Sustainability Co., Ltd. under the International Standards on Assurance Engagements 3000 and 3410.
Indicators Subject to Independent Assurance :
- Sojitz Corporation: Electricity Consumption, GHG Emissions, Water Consumption, Waste Discharge, Resource Recycling Amounts, and Recycling Rate
- Sojitz Group: Electricity Consumption, GHG Emissions, Water Consumption, Waste Discharge
- Supply chain for the power sector (Sojitz Group’s supply chain related thermal coal interests, thermal coal sales, and petroleum gas power generation businesses): GHG emissions
- Supply chain for the coking coal sector: GHG emissions
Read more
FY2024 Independent Practitioner's Limited Assurance Report
GHG emissions quantification is subject to uncertainty when measuring activity data, determining emission factors, and considering scientific uncertainty inherent in the Global Warming Potentials.
■ GHG
Sojitz Corporation’s GHG Emissions
1. Data and Results
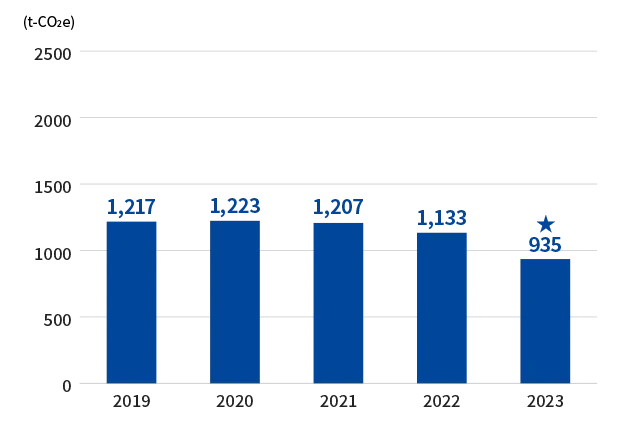
(unit:t-CO2e)
| FY2019 | FY2020 | FY2021 | FY2022 | FY2023 | FY2024 | |||
|---|---|---|---|---|---|---|---|---|
| Scope1 | energy-related CO2 |
14 | 25 | 28 | 24 | 25 | 22★ | |
| Scope2 | energy-related CO2 |
Location based method | 1,203 | 1,198 | 1,178 | 1,109 | 1,132 | 1,104★ |
| Maket based method | - | - | - | - | 911 | 10★ | ||
| Total Scope 1+Scope 2 | Location based method | 1,217 | 1,223 | 1,207 | 1,133 | 1,157 | 1,127★ | |
| Maket based method | - | - | - | - | 935 | 32★ | ||
2. Boundary of Data
Sojitz Corporation: Head office, Kansai Office, and branches (Hokkaido, Tohoku and Nagoya)
3. CO2 Emissions factors
[For electricity]
Location based method: We use the actual emission factors announced by the Electric Power Council for a Low Carbon Society (ELCS)
Market based method: We use the base emission factors of each electric power company (published by the Ministry of the Environment and the Ministry of Economy, Trade and Industry in March 2025).
[For energy-related CO2 from fuel]
Emission factors used for fuel are as specified by the Act on Promotion of Global Warming Countermeasures.
- The reduction in emissions based on market standards is due to the use of renewable energy at the Head office from the FY2024 and at the Kansai office from the FY2023.
Sojitz Group’s GHG Emissions
1. Data and Results
(unit:t-CO2e)
| FY2019 | FY2020 | FY2021 | FY2022 | FY2023 | FY2024 | |||
|---|---|---|---|---|---|---|---|---|
| Scope1 |
energy-related CO2 |
979,348 | 721,934 | 721,769 | 751,233 | 577,458 | 532,203★ | |
GHG emissions other than energy-related CO2* |
- | - | - | - | - | 48,701★ | ||
| Scope2 | energy-related CO2 |
Location based method | 152,108 | 206,283 | 219,180 | 206,851 | 207,278 | 212,611★ |
| Maket based method | - | - | - | - | 204,475 | 189,852★ | ||
GHG emissions other than energy-related CO2* |
- | - | - | - | - | 5,827★ | ||
| Total Scope 1+Scope 2 | Location based method | 1,131,456 | 928,217 | 940,948 | 958,084 | 784,736 | 799,343★ | |
| Maket based method | - | - | - | - | 781,933 | 776,583★ | ||
| Scope1 <Non energy-related CO2 and GHGs other than CO2> | FY2019 | FY2020 | FY2021 | FY2022 | FY2023 | FY2024 | |
|---|---|---|---|---|---|---|---|
Non energy-related CO2 |
- | - | - | - | - | 286 | |
Methane (CH4) |
- | - | - | - | - | 41,052 | |
Dinitrogen monoxide (N2O) |
- | - | - | - | - | 2,557 | |
Hydrofluorocarbons (HFCs) |
- | - | - | - | - | 4,807 | |
Perfluorocarbons (PFCs) |
- | - | - | - | - | - | |
Sulfur hexafluoride (SF6) |
- | - | - | - | - | - | |
Nitrogen trifluoride (NF3) |
- | - | - | - | - | - | |
| Scope2 <Non energy-related CO2 and GHGs other than CO2> | FY2019 | FY2020 | FY2021 | FY2022 | FY2023 | FY2024 | |
|---|---|---|---|---|---|---|---|
Non energy-related CO2 |
- | - | - | - | - | - | |
Methane (CH4) |
- | - | - | - | - | 364 | |
Dinitrogen monoxide (N2O) |
- | - | - | - | - | 5,463 | |
2. Boundary of Data
Sojitz Corporation, all domestic and overseas consolidated subsidiaries, and unincorporated joint ventures subject to reporting under the operational control approach.
*Energy-related CO2 refers to carbon dioxide emitted during the combustion of fossil fuels (coal, oil, gas).
*In addition to energy-related CO2, the following GHG emissions are also included in the calculation:
CO2 :Coal ptoduction.
CH4 :Fuel usage in facilities and machinery for fuel Combustion and coal production.
N2O :Fuel usage in facilities and machinery for fuel Combustion.
HFCs :Recovery and use of HFCs in commercial refrigeration and air conditioning equipment in the marine food products and processing businesses.
3. Target for Emissions Reduction
Group companies in Japan including Sojitz Corporation aim to reduce domestic GHG emissions by a 1% reduction rate per fiscal year.
Read more:
4. Emissions factors
Emissions are calculated with the calorific values and emission factors specified in the “Act on the Rational Use of Energy” and “Act on Promotion of Global Warming Countermeasures.
[For electricity]
・Location based method: In Japan, we use the actual emission factors announced by the Electric Power Council for a Low Carbon Society (ELCS) . Overseas, we use the factors according to country, as published by the International Energy Agency (IEA).
・Market based method: We use the factors of each electric power company in principle, but if it is not available, use the emission factors based on location based method.
[For Energy-related CO2 from fuel]
Emission factors used for fuel are as specified by the Act on Promotion of Global Warming Countermeasures.
[GHG emissions other than energy-related CO2]
Coal production: Emission factors set based on the emission factors published by Australia's National Greenhouse and Energy Reporting (NGER) scheme and and gas test measurement data are used.
Fuel usage in facilities and machinery for fuel Combustion: the emission factors stipulated in the Act on Promotion of Global Warming Countermeasures are used, and for calculating fuel usage in heavy machinery at coal mines, emission factors from the United States Environmental Protection Agency (EPA) are used.
Recovery and use of HFCs in commercial refrigeration and air conditioning equipment in the marine food products and processing businesses: the emission factors stipulated in the Act on Rational Use and Appropriate Management of Fluorocarbons (Fluorocarbon Emission Control Law) are used.
- In the FY2023, we revised the boundary of the data collection and restated figures for the FY2019 to 2022.
Sojitz Group's GHG Emissions - Changes in Output
(unit:t-CO2e per person)
| FY2019 | FY2020 | FY2021 | FY2022 | FY2023 | FY2024 |
|---|---|---|---|---|---|
| 59.6 | 46.9 | 44.5 | 45.3 | 34.3 | 30.9 |
(GHG emissions by Sojitz Group companies worldwide, including Sojitz Corporation,divided by the number of employees belonging to consolidated subsidiaries worldwide)
Sojitz Group’s CO2 Scope 3 Emissions
(unit: 10,000 t-CO2e)
| Category | Y2024 | ||
|---|---|---|---|
| Scope 3 | 1 | Purchased goods and services | 2,132 |
| 2 | Capital goods | 2 | |
| 3 | Fuel- and energy-related activities (not included in Scope 1 or Scope 2) | 13 | |
| 4 | Upstream transportation and distribution | 860 | |
| 5 | Waste generated in operations | 1 | |
| 6 | Business travel | 0 | |
| 7 | Employee commuting | 0 | |
| 8 | Upstream leased assets | 0 | |
| 9 | Downstream transportation and distribution | (included in Category 4) | |
| 10 | Processing of sold products | 68 | |
| 11 | Use of sold products | 2,973 | |
| 12 | End-of-life treatment of sold products | 938 | |
| 13 | Downstream leased assets | 0 | |
| 14 | Franchises | 0 | |
| 15 | Investments | 349 | |
| Total | 7,336 | ||
- Sojitz performs calculations for Scope 3 emissions using methodologies and assumptions set by the company. Figures include both third-party verified and unverified emissions.
- Scope 3 emissions are measured for Sojitz Corporation, major consolidated subsidiaries (domestic and overseas) and unincorporated joint ventures subject to reporting emissions under the operational control approach.
- Clear instances of double counting (the same emission source reported by multiple companies within the data scope) have been excluded from the calculations.
- Instances in which Sojitz cannot identify the final products made using intermediate products sold by a Group company have been excluded from the calculations for category 10.
- Products that directly emit GHG when in use (such as automobiles and machinery) have been included in the calculations for category 11.
- Sojitz performs its calculations using the emission factors specified in the "Policy on Emission Unit Values for Accounting of Greenhouse Gas Emissions by Organizations Throughout the Supply Chain", the "Act on Promotion of Global Warming Countermeasures" published by the Ministry of the Environment and Ministry of Economy, Trade and Industry, as well as emission factors published by other industry organizations.
GHG emissions for supply chains in the power sector (Scope 1, Scope 2, and Scope 3)
1. Data and Results (FY2024)
Thermal coal
| Scope | Emission volumes (t-CO2e) |
Calculation methods / Other | ||
|---|---|---|---|---|
| Scope 1 and 2 | 65,130 | |||
| category(*) | ||||
| Scope3 | 1 | Purchased goods and services | 619,508 | Calculated by multiplying the production of thermal coal traded by Sojitz by an emissions factor. |
| 2 | Capital goods | 70 | Calculated by multiplying the capital investment by an emissions factor. | |
| 3 | Fuel- and energy-related activities (not included in scope 1 or scope 2) |
3,347 | Calculated by multiplying the fuel and electricity consumption by emissions factors. | |
| 4 | Upstream transportation and distribution | 146,389 | Calculated by multiplying the sold thermal coal traded by Sojitz (including that from the mines in which Sojitz holds equity interests) by transportation distance and emissions factors, or by multiplying fuel consumption by emissions factors. Transportation distance is calculated up until the trader in the case where the sales destination is a trader and Sojitz is unable to ascertain the destination beyond them. | |
| 5 | Waste generated in operations | 16 | Calculated by multiplying the waste generated in operations by an emissions factor. | |
| 6 | Business travel | - | - | |
| 7 | Employee commuting | - | - | |
| 8 | Upstream leased assets | - | Not applicable based on the specific attributes of the business | |
| 9 | Downstream transportation and distribution | - | - | |
| 10 | Processing of sold products | - | Not applicable based on the specific attributes of the business | |
| 11 | Use of sold products | 11,813,899 | Calculated by multiplying the thermal coal traded by Sojitz by an emissions factor. | |
| 12 | End-of-life treatment of sold products | - | Not applicable based on the specific attributes of the business | |
| 13 | Downstream leased assets | - | Not applicable based on the specific attributes of the business | |
| 14 | Franchises | - | Not applicable based on the specific attributes of the business | |
| 15 | Investments | - | ||
| Total | 12,583,228 | |||
| Total for supply chain | 12,648,357★ | |||
- Supply chain categories are in accordance with established GHG protocol
Oil & Gas
| Scope | Emission volumes (t-CO2e) |
Calculation methods / Other | ||
|---|---|---|---|---|
| Scope 1 and 2 | 14,682 | |||
| category(*) | ||||
| Scope3 | 1 | Purchased goods and services | - | Not applicable based on the specific attributes of the business |
| 2 | Capital goods | - | - | |
| 3 | Fuel- and energy-related activities (not included in scope 1 or scope 2) |
2,364 | Calculated by multiplying the fuel and electricity consumption of the consolidated subsidiaries operating power plants by emissions factors. | |
| 4 | Upstream transportation and distribution | - | Not applicable based on the specific attributes of the business | |
| 5 | Waste generated in operations | - | - | |
| 6 | Business travel | - | - | |
| 7 | Employee commuting | - | - | |
| 8 | Upstream leased assets | - | Not applicable based on the specific attributes of the business | |
| 9 | Downstream transportation and distribution | - | Not applicable based on the specific attributes of the business | |
| 10 | Processing of sold products | - | Not applicable based on the specific attributes of the business | |
| 11 | Use of sold products | - | Not applicable based on the specific attributes of the business | |
| 12 | End-of-life treatment of sold products | - | Not applicable based on the specific attributes of the business | |
| 13 | Downstream leased assets | - | Not applicable based on the specific attributes of the business | |
| 14 | Franchises | - | Not applicable based on the specific attributes of the business | |
| 15 | Investments | 1,454,981 | The sum of the emissions from the power plants of the companies in which Sojitz holds equity interest, calculated by multiplying the fuel and electricity consumption by emission factors, and the emissions calculated by multiplying the production of oil and gas by emission factors. | |
| Total | 1,457,345 | |||
| Total for supply chain | 1,472,027★ | |||
- Supply chain categories are in accordance with established GHG protocol
2. Boundary of Data
Sojitz Corporation, all domestic and overseas consolidated subsidiaries, and unincorporated joint ventures subject to reporting under the operational control approach.
Power sector supply chain (Sojitz Group’s supply chain related to thermal coal interests, thermal coal sales, and oil and gas power generation-related businesses)
In order to assess risks related to decarbonization, Sojitz conducts analysis of GHG emissions for the entire supply chain (Scope 1, Scope 2, and Scope 3). We prioritize refining our quantitative data in the power sector as it accounts for high GHG emissions and has a large-scale impact on our business.
3. CO2 Emissions factors
Calculated with the emission factors specified in the “Emissions Unit Values for Accounting of Greenhouse Gas Emissions, etc., by Organizations Throughout the Supply Chain," and "Act on Promotion of Global Warming Countermeasures" published by the Ministry of Economy, Trade, and Industry and the Ministry of the Environment.
GHG emissions for supply chains in the steel sector (Scope1, Scope2, and Scope3)
1. Data and Results(FY2024)
Coking coal
| Scope | Emission volumes (t-CO2e) |
Calculation methods / Other | ||
|---|---|---|---|---|
| Scope 1 and 2 | 62,331 | |||
| category(*) | ||||
| Scope3 | 1 | Purchased goods and services | 75,894 | Calculated by multiplying the production of coking coal traded by Sojitz by an emissions factor. |
| 2 | Capital goods | 10,171 | Calculated by multiplying the capital investment by an emissions factor. | |
| 3 | Fuel- and energy-related activities (not included in scope 1 or scope 2) |
10,183 | Calculated by multiplying the fuel and electricity consumption by emissions factors. | |
| 4 | Upstream transportation and distribution | 43,770 | Calculated by multiplying the sold coking coal traded by Sojitz (including that from the mines in which Sojitz holds equity interests) by transportation distance and emissions factors, or by multiplying fuel consumption by emissions factors. Transportation distance is calculated up until the trader in the case where the sales destination is a trader and Sojitz is unable to ascertain the destination beyond them. | |
| 5 | Waste generated in operations | 134 | Calculated by multiplying the waste generated in operations by an emissions factor. | |
| 6 | Business travel | - | - | |
| 7 | Employee commuting | - | - | |
| 8 | Upstream leased assets | - | Not applicable based on the specific attributes of the business | |
| 9 | Downstream transportation and distribution | - | - | |
| 10 | Processing of sold products | - | Not applicable based on the specific attributes of the business | |
| 11 | Use of sold products | 5,171,041 | Calculated by multiplying the coking coal traded by Sojitz by an emissions factor. | |
| 12 | End-of-life treatment of sold products | - | Not applicable based on the specific attributes of the business | |
| 13 | Downstream leased assets | - | Not applicable based on the specific attributes of the business | |
| 14 | Franchises | - | Not applicable based on the specific attributes of the business | |
| 15 | Investments | 293,191 | Scope 1 and Scope 2 emissions of the coal mines in which Sojitz holds equity interest. | |
| Total | 5,604,384 | |||
| Total for supply chain | 5,666,715★ | |||
- Supply chain categories are in accordance with established GHG protocol
2. Boundary of Data
Sojitz Corporation, all domestic and overseas consolidated subsidiaries, and unincorporated joint ventures subject to reporting under the operational control approach.
Steel making sector supply chain (Sojitz Group’s supply chain related to coking coal interests and coking coal sales)
In order to assess risks related to decarbonization, Sojitz conducts analysis of GHG emissions for the entire supply chain (Scope 1, Scope 2, and Scope 3). We prioritize refining our quantitative data in the sector as it accounts for high GHG emissions and has a large-scale impact on our business.
3. GHG Emissions factors
Calculated with the emission factors specified in the “Emissions Unit Values for Accounting of Greenhouse Gas Emissions, etc., by Organizations Throughout the Supply Chain," and "Act on Promotion of Global Warming Countermeasures" published by the Ministry of Economy, Trade, and Industry and the Ministry of the Environment.
Sojitz Corporation’s Scope 3 Emissions
Logistics-related CO2 Emissions
1. Data and Results
See the graph below to view Sojitz Corporation’s freight transport-related CO2 emissions in Japan, where Sojitz Corporation is classified as the owner of the goods according to the Energy Conservation Law.
(unit:t-CO2e)
| FY2019 | FY2020 | FY2021 | FY2022 | FY2023 | FY2024 |
|---|---|---|---|---|---|
| 8,918 | 9,847 | 10,828 | 8,980 | 8,718 | 5,208 |
2. Initiatives
Energy reduction initiatives include modal shifts, selecting the most appropriate type of vehicle, and strategically selecting transportation routes.
CO2 emissions resulting from overseas business trips
1. Data and Results
(unit:t-CO2e)
| FY2019 | FY2020 | FY2021 | FY2022 | FY2023 | FY2024 |
|---|---|---|---|---|---|
| 2,828 | 33 | 178 | 1,266 | 1,718 | 1,913 |
2. Boundary of Data
Refers to flights to/from Japan taken by Sojitz Corporation employees. We have divided business trip destinations into six areas and selected a major airport from each area to use in determining distances for the calculation of passenger kilometer data.
3. CO2 Emissions factors
Calculated with the emission factors specified in the "Emissions Unit Values for Accounting of Greenhouse Gas Emissions, etc., by Organizations Throughout the Supply Chain," published by the Ministry of Economy, Trade, and Industry and the Ministry of the Environment.
CO2 emissions resulting from commuting
1. Data and Results
(unit:t-CO2e)
| FY2019 | FY2020 | FY2021 | FY2022 | FY2023 | FY2024 |
|---|---|---|---|---|---|
| 472 | 722 | 756 | 702 | 743 | 814 |
2. Boundary of Data
Emissions from trains and buses used by Sojitz Corporation employees.
3. CO2 Emissions factors
Calculated with the emission factors specified in the "Emissions Unit Values for Accounting of Greenhouse Gas Emissions, etc., by Organizations Throughout the Supply Chain," published by the Ministry of Economy, Trade, and Industry and the Ministry of the Environment.
(CO2 emissions by Sojitz Group companies worldwide, including Sojitz Corporation,divided by the number of employees belonging to consolidated subsidiaries worldwide)
■ Energy
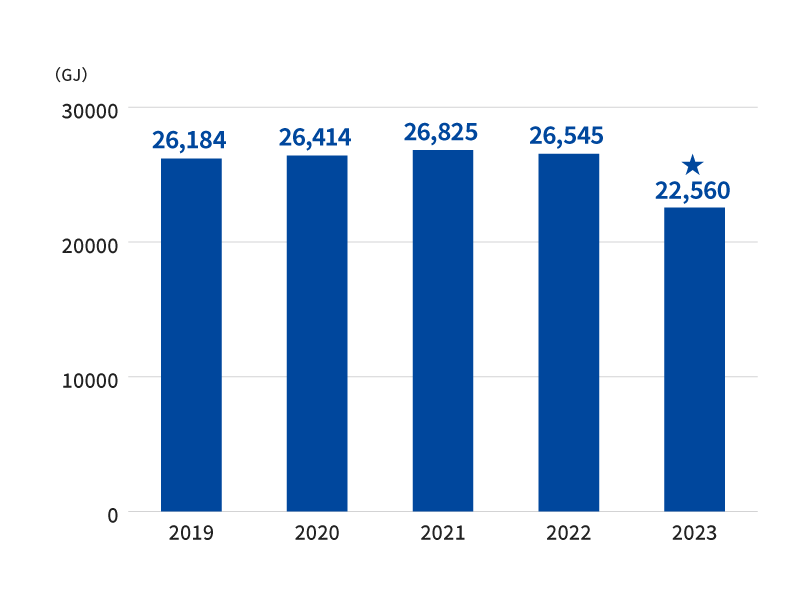
Sojitz Corporation’s Energy Consumption(Calorific value)
1. Data and Results
2. Boundary of Data
Sojitz Corporation: Head office, Kansai Office , and branches (Hokkaido, Tohoku and Nagoya)
In FY2024, the unit calorific conversion factors were revised, and figures for FY2019 to 2023 were restated.
Sojitz Group’s Energy Usage(Calorific value)
1. Data and Results
(unit:GJ)
| FY2019 | FY2020 | FY2021 | FY2022 | FY2023 | FY2024 | |
|---|---|---|---|---|---|---|
| Energy Usage(Calorific value) | 18,203,338 | 14,137,265 | 14,961,181 | 15,372,013 | 12,644,834 | 12,059,075 ★ |
2. Boundary of Data
Sojitz Corporation, all domestic and overseas consolidated subsidiaries, and unincorporated joint ventures subject to reporting under the operational control approach
- In FY2023, the boundary of the data collection was revised, and figures for FY2019 to 2022 were restated.
- In FY2024, carolific conversion factors and the energy scope were revised, and figures for FY2019 to 2023 were restated.
■ Electricity
Sojitz Corporation's Electricity Consumption and GHG Emissions
1. Data and Results
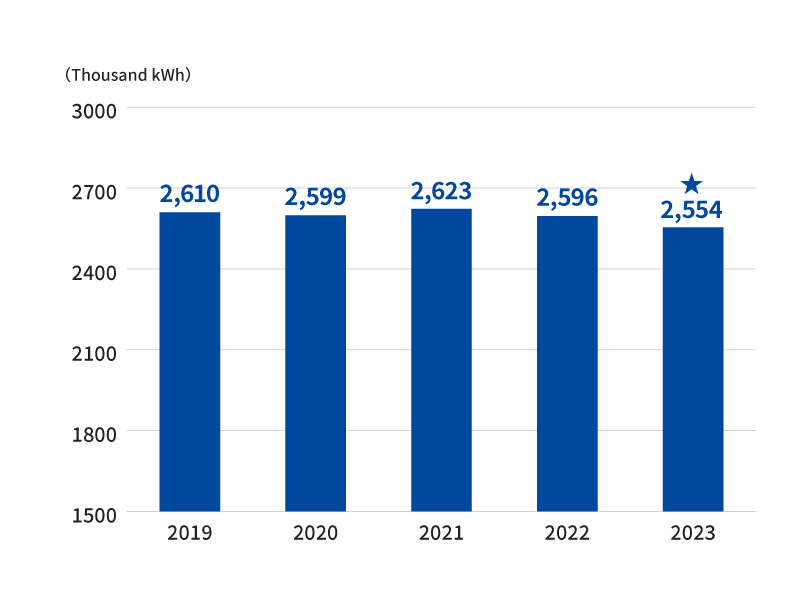
(unit:thousand kWh)
| FY2019 | FY2020 | FY2021 | FY2022 | FY2023 | FY2024 | |
|---|---|---|---|---|---|---|
| Total electricity consumption | 2,610 | 2,599 | 2,623 | 2,596 | 2,554 | 2,539★ |
| -Of total electricity, amount of electric power from renewable energy used | 0 | 0 | 10 | 0 | 223 | 2,516 |
| -generated internally utilizing renewable resources | 0 | 0 | 0 | 0 | 0 | 0 |
| -purchased renewable energy electricity amounts | 0 | 0 | 0 | 0 | 223 | 227 |
| -purchased non-fossil fuel certificates | 0 | 0 | 10 | 0 | 0 | 2,289 |
2. Boundary of Data
Sojitz Corporation: Head office, Kansai Office, and branches (Hokkaido, Tohoku and Nagoya)
From the FY2024, our Head office has been using renewable energy. Similarly, our Kansai Office has been using renewable energy since the FY2023.
Sojitz Group’s Electricity Consumption
1. Data and Results
(unit:thousand kWh)
| FY2019 | FY2020 | FY2021 | FY2022 | FY2023 | FY2024 | |
|---|---|---|---|---|---|---|
| Total electricity consumption | 220,930 | 263,805 | 266,035 | 295,834 | 311,811 | 340,747★ |
| -Of total electricity, amount of electric power from renewable energy used | 162 | 210 | 760 | 3,015 | 8,929 | 45,419 |
| -generated internally utilizing renewable resources | 0 | 4 | 70 | 1,582 | 3,290 | 4,215 |
| -purchased renewable energy electricity amounts | 162 | 206 | 680 | 1,433 | 5,639 | 38,914 |
| -purchased non-fossil fuel certificates | 0 | 0 | 10 | 0 | 0 | 2,289 |
2. Boundary of Data
Sojitz Corporation, all domestic and overseas consolidated subsidiaries, and unincorporated joint ventures subject to reporting under the operational control approach.
■ Water Consumption
Sojitz Corporation’s Water Usage
1. Data and Results
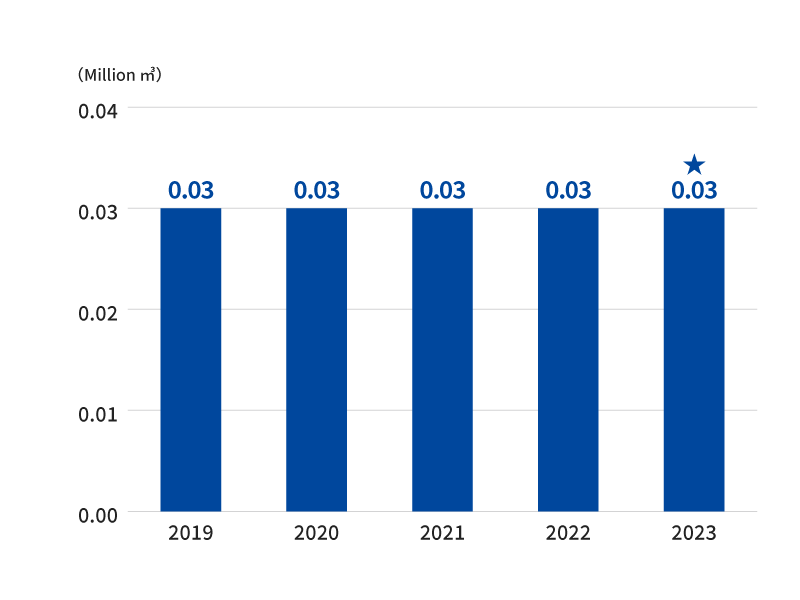
- Water usage for the Tokyo head office and Kansai Office was calculated using an estimate based on the number of employees in each office.
2. Boundary of Data
Sojitz Corporation: Head office, Kansai Office excluding branches (Hokkaido, Tohoku and Nagoya).
Sojitz Group’s Water Usage
Sojitz Group’s Water Usage
1. Data and Results
(unit:million m3)
| FY2019 | FY2020 | FY2021 | FY2022 | FY2023 | FY2024 | |
|---|---|---|---|---|---|---|
| Water Usage (freshwater) | 4.77 | 5.03 | 4.50 | 4.97 | 5.36 | 5.64 ★ |
2. Boundary of Data
Sojitz Corporation, all domestic and overseas consolidated subsidiaries, and unincorporated joint ventures subject to reporting under the operational control approach
Water withdrawal by source
1. Data and Results
(unit:m3)
| FY2019 | FY2020 | FY2021 | FY2022 | FY2023 | FY2024 | |||
|---|---|---|---|---|---|---|---|---|
| Tap water, industrial water | 3,020,934 | 3,351,857 | 2,971,193 | 3,318,064 | 3,718,103 | 3,602,270 | ||
| Groundwater | 521,059 | 456,654 | 462,202 | 472,977 | 438,276 | 515,803 | ||
| River water | 1,220,977 | 1,213,895 | 1,068,290 | 1,176,457 | 1,198,352 | 1,516,756 | ||
| Rainwater | 4,048 | 3,360 | 2,847 | 2,600 | 3,220 | 4,783 | ||
| Freshwater total | 4,767,018 | 5,025,766 | 4,504,531 | 4,970,099 | 5,357,952 | 5,639,613 | ||
| Seawater | 178,401,225 | 151,920,000 | 174,576,000 | 175,332,600 | 175,918,572 | 189,036,097 | ||
| Total (including seawater) | 183,168,243 | 156,945,766 | 179,080,531 | 180,302,699 | 181,276,524 | 194,675,710 | ||
2. Boundary of Data
Sojitz Corporation, all domestic and overseas consolidated subsidiaries, and unincorporated joint ventures subject to reporting under the operational control approach
Amount of wastewater discharged according to discharge site
1. Data and Results
(unit:m3)
| FY2019 | FY2020 | FY2021 | FY2022 | FY2023 | FY2024 | |||
|---|---|---|---|---|---|---|---|---|
| River | 2,741,447 | 2,827,894 | 2,679,339 | 2,942,748 | 2,844,998 | 2,730,143 | ||
| Sewer | 245,527 | 166,796 | 773,007 | 672,474 | 311,352 | 353,213 | ||
| Underground seepage | 6,589 | 5,898 | 5,879 | 15,951 | 108,794 | 17,814 | ||
| Other | 112,954 | 68,323 | 33,471 | 66,065 | 140,537 | 244,339 | ||
| Freshwater total | 3,106,517 | 3,068,911 | 3,491,696 | 3,697,238 | 3,405,681 | 3,345,509 | ||
| Ocean | 177,677,695 | 151,275,080 | 173,784,135 | 174,651,748 | 175,201,281 | 188,322,693 | ||
| Total (including seawater) | 180,784,212 | 154,343,992 | 177,275,831 | 178,348,986 | 178,606,962 | 191,668,203 | ||
2. Boundary of Data
Sojitz Corporation, all domestic and overseas consolidated subsidiaries, and unincorporated joint ventures subject to reporting under the operational control approach
Recycle Rate for Water Used
1. Data and Results
| FY2019 | FY2020 | FY2021 | FY2022 | FY2023 | FY2024 |
|---|---|---|---|---|---|
| 9% | 8% | 3% | 1% | 1% | 1% |
(Amount of water recycled divided by total usage)
2. Boundary of Data
Sojitz Corporation, all domestic and overseas consolidated subsidiaries, and unincorporated joint ventures subject to reporting under the operational control approach
COD and BOD Amounts
1. Data and Results
(unit:t)
| FY2019 | FY2020 | FY2021 | FY2022 | FY2023 | FY2024 | |
|---|---|---|---|---|---|---|
| COD | 3,421 | 2,796 | 601 | 551 | 500 | 662 |
| BOD | 3,345 | 2,694 | 427 | 441 | 403 | 497 |
2. Boundary of Data
Sojitz Corporation, all domestic and overseas consolidated subsidiaries, and unincorporated joint ventures subject to reporting under the operational control approach
■ Waste Discharge
Sojitz Corporation’s Waste Discharge and Recycling Rates
1. Data and Results
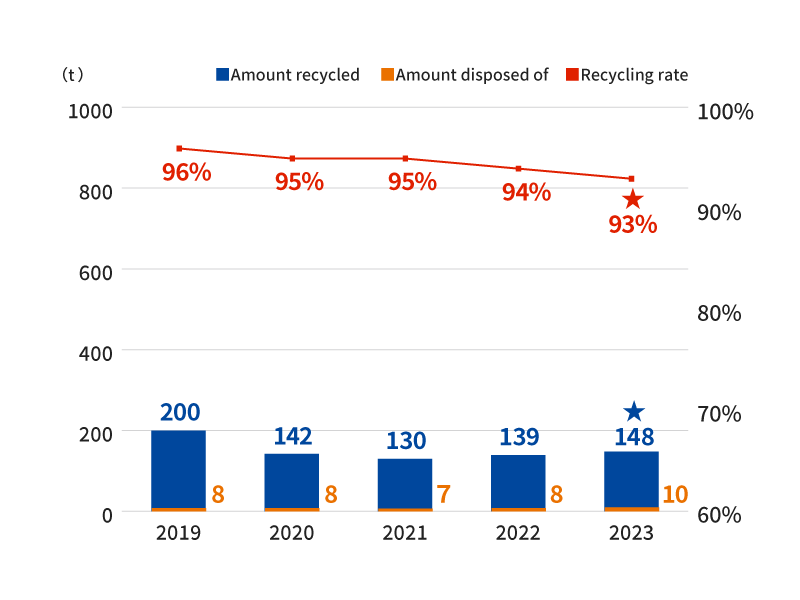
2. Boundary of Data
Sojitz Corporation: Head office, Kansai Office, excluding branches (Hokkaido, Tohoku and Nagoya)
3. Target Recycling Rate
Office recycling target: Maintain a recycling rate of 90% for office waste.
4. Hazardous waste
(unit:t)
| FY2019 | FY2020 | FY2021 | FY2022 | FY2023 | FY2024 | |
|---|---|---|---|---|---|---|
| Hazardous waste* | 0.02 | 0.02 | 0.13 | 0.03 | 0.02 | 0.03 |
- The total amount of specially controlled industrial waste generated by Sojitz Corporation.
Sojitz Group’s Waste Discharge
1. Data and Results
(unit:t)
| FY2019 | FY2020 | FY2021 | FY2022 | FY2023 | FY2024 | |
|---|---|---|---|---|---|---|
| Waste Discharge | 60,485 | 67,711 | 62,769 | 67,103 | 76,829 | 76,785 ★ |
| -Amount recycled | 8,281 | 7,100 | 18,000 | 32,939 | 15,736 | 10,851 |
| -Amount disposed of | 52,203 | 60,611 | 44,768 | 34,163 | 61,093 | 67,935 |
2. Boundary of Data
Sojitz Corporation, all domestic and overseas consolidated subsidiaries, and unincorporated joint ventures subject to reporting under the operational control approach
■ Paper Consumption
Sojitz Corporation’s Paper Usage
1. Data and Results
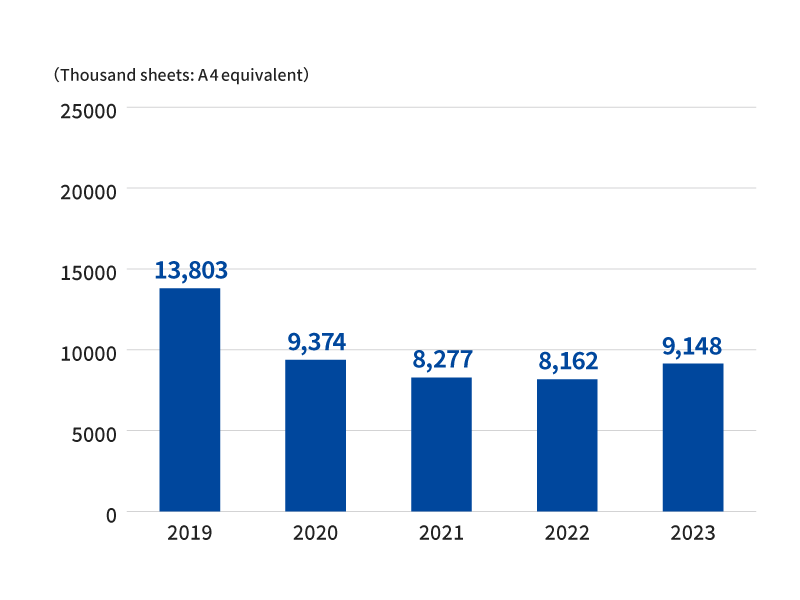
2. Boundary of Data
Sojitz Corporation: Head office, Kansai Office
■ Other Environmental Data
Sojitz Group's NOx, SOx and VOC Emissions
(unit:t)
| FY2019 | FY2020 | FY2021 | FY2022 | FY2023 | FY2024 | |
|---|---|---|---|---|---|---|
| NOX (Nitrogen Oxides) | 2,632 | 1,704 | 2,255 | 2,516 | 1,656 | 1,348 |
| SOX (Sulfur Oxides) | 408 | 593 | 358 | 717 | 518 | 152 |
| VOC (Volatile Organic Compounds) | 127 | 138 | 210 | 195 | 195 | 180 |