Last
JPY
JPY
(%)
Securities Code : 2768
Last
JPY
JPY
(%)
(Real Time)
JPY
%
BN JPY
more Financial Results Materials
(BN JPY)
| FY2024 | FY2025 | Difference | ||
|---|---|---|---|---|
| Revenue | 2,509.7 | 2,757.4 | + 247.7 | |
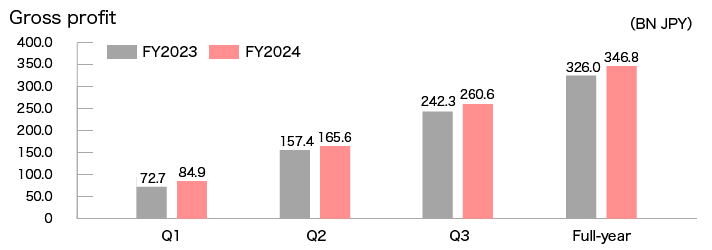
| Gross profit | 346.8 | 367.5 | + 20.7 | |
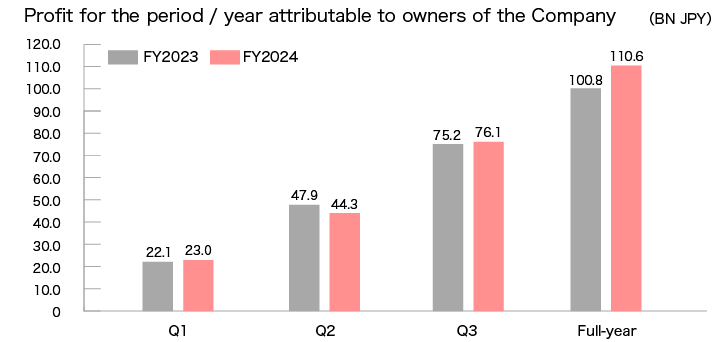
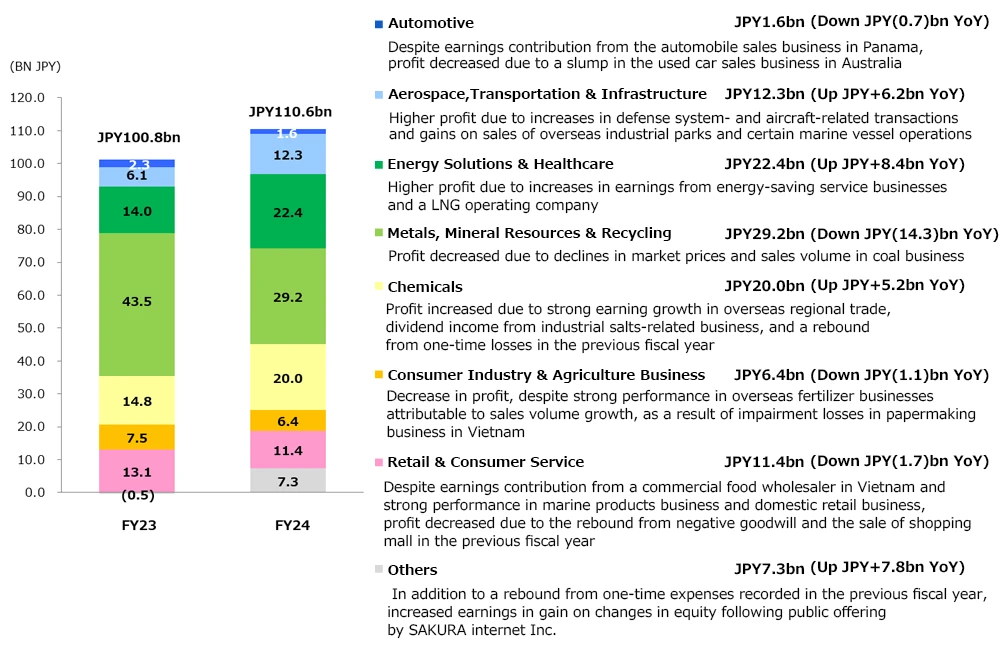
| Profit for the period attributable to owners of the Company | 110.6 | 103.6 | (7.0) |
(BN JPY)
| FY2024 | FY2025 | Difference | |
|---|---|---|---|
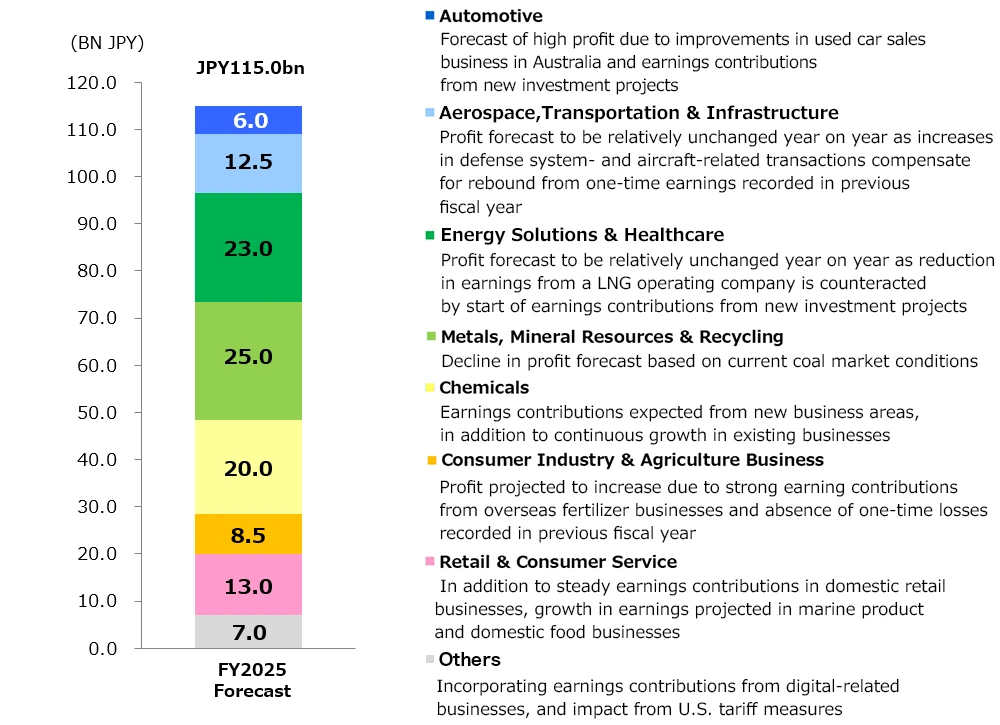
| Automotive | 1.6 | (5.3) | (6.9) |
| Aerospace, Transportation & Infrastructure | 12.2 | 15.5 | +3.3 |
| Energy Solutions & Healthcare | 22.6 | 31.9 | +9.3 |
| Metals, Mineral Resources & Recycling | 29.2 | 4.8 | (24.4) |
| Chemicals | 20.0 | 20.0 | 0.0 |
| Consumer Industry & Agriculture Business | 6.4 | 5.9 | (0.5) |
| Retail & Consumer Service | 11.4 | 14.2 | +2.8 |
| Others | 7.2 | 16.6 | +9.4 |
| FY24 Results (Annual Avg.) |
FY25 Results (Annual Avg.) |
FY26 Assumptions |
Latest Data (As of April 24, 2026) |
|
|---|---|---|---|---|
| Coking coal *1 |
US$210/t | US$201/t | US$210/t | US$231/t |
| Thermal coal *1 |
US$130/t | US$110/t | US$120/t | US$126/t |
| Crude oil (Brent) | US$78.2/bbl | US$69.0/bbl | US$70.0/bbl | US$105.3/bbl |
| Exchange rate *2 |
JPY152.6/US$ | JPY151.1/US$ | JPY150.0/US$ | JPY159.8/US$ |
| Interest Rate(TIBOR) | 0.48% | 0.90% | 1.45% | 1.25% |
(BN JPY)
| FY2025 Results |
FY2026 Forecast |
Difference |
|
|---|---|---|---|
| Gross profit | 367.5 | 440.0 | + 72.5 |
Profit for the Year (attributable to owners of the Company) |
103.6 | 130.0 | + 26.4 |
This document contains forward-looking statements based on information available to the Company at the time of disclosure and certain assumptions that management believes to be reasonable. Actual results may differ materially based on various factors including the timing at which the changes in economic conditions in key markets, both in and outside of Japan, and exchange rate movements. The Company will provide timely disclosure of any material changes, events, or other relevant issues.
This Website was created for the purpose of providing information relating to Sojitz corporation. It was not created to solicit investors to buy or sell Sojitz Corporation's stock. The final decision and responsibility for investments rests solely with the user of this Website and its content.
This website contains forward-looking statements about future performance, events or management plans of the Company based on the available information, certain assumptions and expectation at the point of disclosure, of which many are beyond the Company’s control. These are subject to a number of risks, uncertainties and factors, including but not limited to, economic and financial conditions, factors that may affect the level of demand and financial performance of the major industries and customers we serve, interest rate and currency fluctuations, availability and cost of funding, fluctuations in commodity and materials prices, political turmoil in certain countries and regions, litigations claims, change in laws, regulations and tax rules, and other factors. Actual results, performances and achievements may differ materially from those described explicitly or implicitly in the relevant forward-looking statements. The Company has no responsibility for any possible damages arising from the use of information on this website.
Although the information on this website is prepared with the greatest care, the Company does not guarantee the accuracy, continuity or quality of any information provided on this website or that it is up-to-date, nor does it accept responsibility for any damage or loss arising from the falsification of data by third parties, data downloads, etc., irrespective of the reasons therefore.
Please also be aware that information on this Website may be changed, modified, added or removed at any time without prior notice.